
- Insights from the latest OECD tax statistics
- The Government’s financial statement
- New rules about Provisional Tax when you haven’t previously been a provisional taxpayer
Late last week, the OECD released its fourth edition of its corporate tax statistics. These are becoming pretty essential reading about the corporate tax world. They’re particularly important because as the introduction to the report says, “the database is intended to assist in the study of corporate tax policy and expand the quality and range of data available for the analysis of the impact of base erosion and profit shifting” (the BEPS initiative).
This latest edition has information about corporate tax revenues and trends over the past 20 years. But it also looks beyond headline tax rates at the effective corporate income tax rates. There are particularly interesting sections on R&D tax incentives and on the anonymised and aggregated statistics collected via the country-by-country reporting, which is something that came out of the BEPS initiative. These are an absolute gold-mine for corporate tax statistics.
The primary data analysed here is for the year ended 31st December 2019. The average corporate tax revenues as a share of total tax revenues in that year was 15%, compared with 12.6% in in 2000. And similarly, the average corporate tax revenues as a percentage of GDP have risen from 2.6% in 2000 to 3.1%.
How does Aotearoa New Zealand stack up and compare to those general measures? Well, as a share of total tax revenues and corporate tax revenue in 2019 it was 12.4% of the total, which is below the overall average of 15% but above the OECD average of 9.6%. However, Aotearoa is still well below the Asian Pacific average of just over 18%.
On the other hand, as a share of percentage of GDP, at 3.9% it’s well above the OECD average of 2.98% and the Asia Pacific average of 3.26%.
Quite an interesting dichotomy there, it could be said that corporate tax take is quite low. But when you look at it in the context of as a percentage of GDP, it seems relatively strong.
The report notes on corporate income tax rates that they had have fallen considerably for most jurisdictions since 2000. 97 jurisdictions, for example, had lower tax rates in 2022 than in 2000. Another 14 had the same, but only six including China have a higher rate.
On average, these rates have been declining. The average combined rate across the 117 jurisdictions covered is now 20% compared to 28% in 2000. Our current 28% is near the top of the pile. Australia is also quite high up with its 30% rate, although that is about to reduce. In 2000, the percentage of jurisdictions where the statutory corporate tax rates were greater than or equal to 20% was 85%. For this year, it’s down to 60%.
But as I’ve said in the past elsewhere and the report notes, the trend has been starting to reverse. The infamous Trussonomics budget was going to reverse corporate tax. Increases proposed for next year. In the wake of that complete disaster those tax increases have been reinstated. And that’s quite a significant change in direction.
The report also examines what is the effective average tax rate across the jurisdictions. This is seen to be a much more accurate tax policy indicator than statutory tax rates. For 2021 the average effective average tax rate across the 77 jurisdictions covered is 20.2% which is 1.2 percentage points lower than the average statutory tax rate of 21.4% for the same year.
Here in Aotearoa-New Zealand, the statutory effective statutory tax rate is 27.1%, which is not far short of our statutory rate of 28%. And that reflects the lack of distortions and special incentives we have in our tax system. In fact, when you examine effective marginal tax rates, we’re in the top ten of all countries at 20.1%. By comparison with many other jurisdictions, such as Finland, which was in the news this week, its effective marginal rate is 15%. Also in the top 10 are Australia with a rate of 16.9% and Japan at 17.2%. Incidentally, Argentina has the top effective marginal tax rate of 29.2%.
The database looks at tax incentives for research and development, and the total of direct government funding and tax support for business R&D as a percentage of GDP in 2019. Across the OECD it was 0.2%. Aotearoa-New Zealand is well down the field at just over 0.1%. What I thought was quite interesting is more than 80% of it comes from direct funding from the government. A very small proportion, barely 20% of that 0.1% is for tax support and that’s actually amongst the lowest across all the OECD.
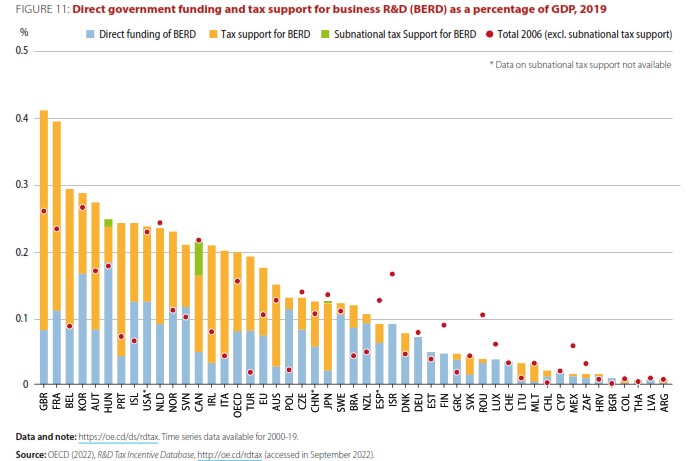
And it seems to me that points to the concerns which are continually raised about productivity. If we’re not investing in R&D, should we be looking harder at why investment in R&D is so low and what can we do to boost it. Has the government been doing too much or not enough and what part of role businesses playing in that?
Another thing that caught my eye which I thought was potentially quite concerning was the contribution of multi-national enterprises (MNEs) to total corporation income tax revenues. At the top is Ireland where 90% of the corporate tax take comes from foreign multinational enterprises.
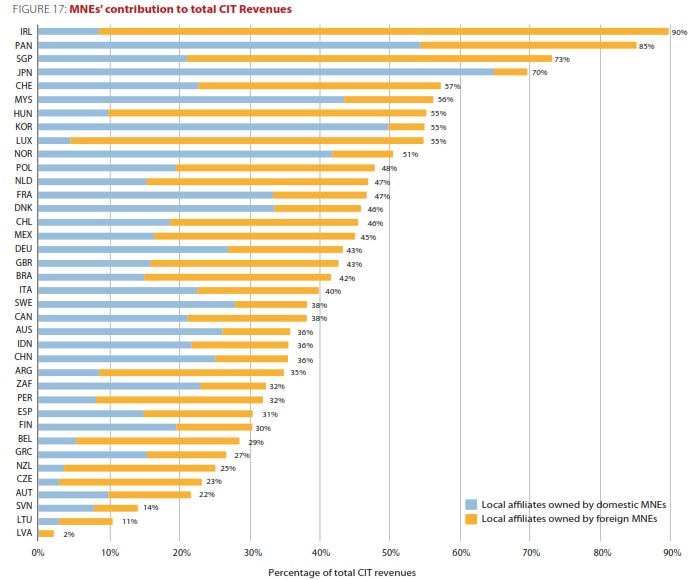
We’re near the bottom with 25% of total corporation tax revenues come from multinationals. So that’s a surprisingly low figure. But what I thought was particularly concerning was the breakdown of this. What the report does it splits the reporting between local affiliates owned by overseas MNEs and local affiliates owned by domestic multinationals. In our case the proportion from domestically owned multinationals is under 5% which appears to be amongst the lowest in the OECD. I think only the Czech Republic and Lithuania have a lower percentage. I wonder whether that points to a lack of diversity in expansion overseas in by our corporate sector.
Some of this information comes from aggregated Country-by-Country Report (CbCR) data which has been collected from almost 7,000 MNEs with turnover exceeding 750m Euros. The data analysed from 47 countries including ourselves indicates “evidence of misalignment between the location where the profits are reported and the location where economic activities occur”
For example, the median value of revenues per employee in jurisdictions with a corporate income tax (CIT) rate of zero is USD 2 million as compared to just USD 300,000 for jurisdictions with a CIT rate above zero. Moreover, in investment hubs, related party revenues account for 35% of total revenues, whereas the average share of related party revenues in high-, middle- and low-income jurisdictions is around 15%. “While these effects could reflect some commercial considerations, they are also likely to indicate the existence of BEPS.”
I think Inland Revenue and other tax authorities will be reviewing this data with interest. Anyway, lots to consider in these statistics, particularly about increasing R&D and the role of overseas export focused multinationals.
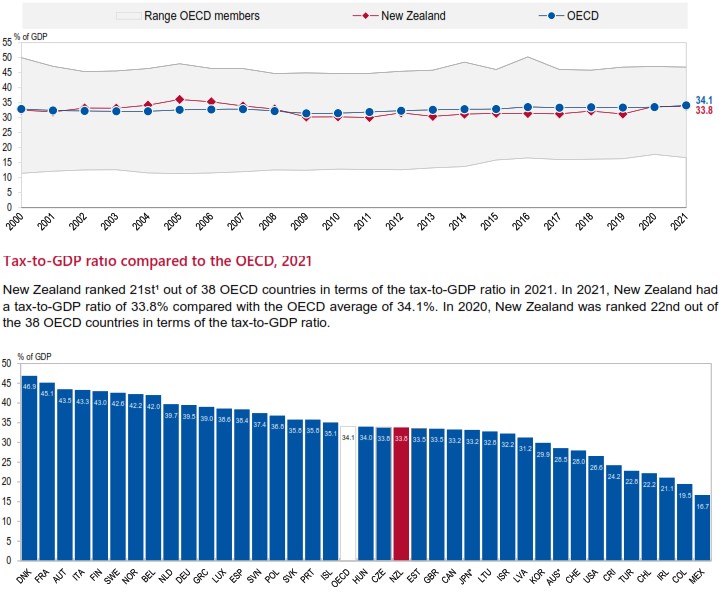
Coincidentally, on Wednesday the OECD also released its Revenue Statistics 2022 edition. This shows how tax revenues bounced back in 2021 as OECD economies recovered from the initial impact of the COVID-19 pandemic. In fact, the OECD average tax-to-GDP ratio rose by 0.6 percentage points in 2021, to 34.1%, the second-strongest year-on-year increase since 1990.
Tax-to-GDP ratios increased in 24 of the 36 OECD countries for which 2021 data on tax revenues was available, declined in 11 and remained unchanged in one. That one country was Aotearoa-New Zealand where the ratio staying at 33.8%, below the OECD average of 34.1% and ranks 21st out of 38 OECD countries.
What the Crown Accounts tax data reveals
It was a busy week for tax data as the Government published its financial statements for the four months to 31st October. The total tax receipts of $35.6 billion for the period is actually $122 million below forecast, which in the scheme of things doesn’t seem too bad. We are seeing fairly strong wage growth from PAYE or source deductions. The forecast was for $14.4 billion but in fact, it was $628 million above that at just over $15 billion. Company income tax was also $302 million above forecast.
However, GST at $9 billion was $945 million below forecast which is a very significant shortfall. Because of the Government extending its cuts to fuel excise duty and road user charges they were 30% lower than forecast, a shortfall of $185 million.
What does all this mean? Firstly, we can see the effect of fiscal drag, which we’ve talked about endlessly. That is the impact as people’s salaries increase and take them across the thresholds, most notably the $48,000 threshold where the tax rate jumps from 17.5% to 30%. We can still see the impact of that, and that’s a factor in the strong growth in PAYE receipts.
To give you an example of the overall effect, the PAYE receipts for the four months to 31st October 2021 were $13.3 billion. But in the four months just ended, these were $1.5 billion or 11% higher at $15 billion. So that’s the effect of fiscal drag which is an issue which isn’t going to go away before next year’s election so expect to see plenty of political posturing and manoeuvring around that issue.
When Bright-line taxes are payable – maybe surprises for some
And finally Inland Revenue have released a draft consultation on the question of provisional tax and the impact on salary of wage earners who receive a one-off amount of income without tax deducted. This scenario could arise where a salary earner realises a gain from the sale of a property subject to the bright-line test. Other instances include shares released under an employee share scheme or one I’ve seen quite frequently, the tax liability arising on the transfer of/or withdrawal from a foreign superannuation scheme.
Typically, when this happens because the taxpayer is on PAYE, they weren’t a provisional taxpayer in the previous tax year as their residual income tax, or RIT, was under $5,000 in the year prior to the receipt of the untaxed sum.
Under the draft consultation, if the tax on the untaxed income is over $5,000 the taxpayer will be deemed to be a provisional taxpayer. But, so long as the total amount of tax payable ends up as being less than $60,000 then the use of money interest exposure will be only start running from the terminal tax date, typically, this would be 7th February following the tax year end of 31st March. This is pretty reasonable and reasonably well understood.
The problem is, though, if the RIT is over $60,000 then the person is meant to pay the tax due on the third provisional tax instalment date, that is 7th of May following the tax year end. If not made, use of money interest starts to apply. Many people affected probably haven’t quite realised that’s when their tax liability is due rather than on the terminal tax date, so it’s good to get clarity on this.
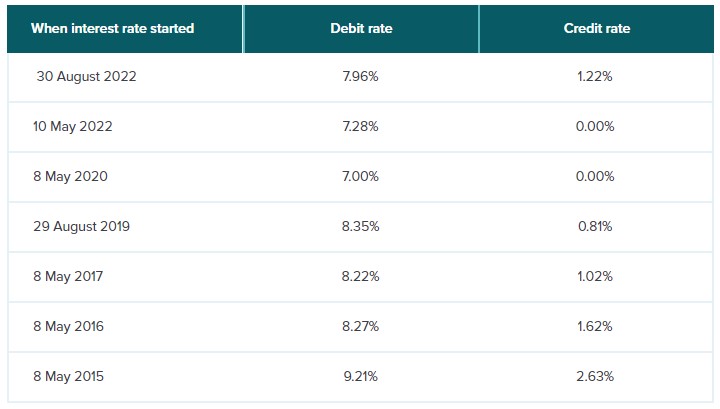
It’s particularly important because Inland Revenue has just announced that use of money interest rates are to rise with effect from 17th January. The rate of underpaid tax will rise to 9.21% with the rate on overpaid tax also increasing to 2.31%. I have to say that that 6.9 percentage point gap is frankly a bit of a laugh, and at odds with some of the somewhat pointed comments made by the Government to banks about social licence and assisting customers during hard times.
And on that note, that’s all for this week. I’m Terry Baucher and you can find this podcast on my website www.baucher.tax or wherever you get your podcasts. Thank you for listening and please send me your feedback and tell your friends and clients.
Until next time kia pai te wiki, have a great week!