20 Nov, 2018 | Tax News
Terry Baucher details how the previous National-led government appears to have successfully raised at least $1 billion of extra revenue annually with little or no fanfare.
Louis XIV’s finance minister, Jean-Baptiste Colbert, famously declared that “the art of taxation consists in so plucking the goose as to obtain the largest possible amount of feathers with the smallest possible amount of hissing.”
What was true in the seventeenth century remains true today. And although Colbert might not recognise much of the modern economy and tax system, he would probably still appreciate some of the sleight of hand used by New Zealand finance ministers to raise funds without too much hissing. At a rough guess the last National government seems to have successfully plucked at least $1 billion of extra revenue annually with little or no fanfare. How?
We’re not talking about specific tax related measures often of a quite technical nature. These are a staple of every government’s budget.
A long-standing option used by governments of both hues is inflation, and in particular ‘fiscal drag’. This is when income tax rate thresholds are not inflation adjusted so wage growth lifts more earners on to higher marginal tax rates.
Income tax rates and thresholds were last adjusted in October 2010. At that time someone on the average wage had a marginal tax rate of 17.5%. According to the labour market statistics for the September 2018 quarter, average weekly earnings are $1,212.82 or $63,067 annually, well above the $48,000 threshold at which the 30% tax rate applies. Even median weekly earnings at $997 are also well above the $48,000 threshold.
So how much revenue does fiscal drag raise annually? The short answer would be “Heaps.” The Budget Economic and Fiscal Update released in May’s Budget estimated the effect of fiscal drag as $1.6 billion over the five years to 30 June 2022.
A more detailed analysis of the issue was prepared for then Finance Minister Bill English in November 2016.
The aide-memoire noted that adjusting for inflation since October 2010, effective 1 April 2017, would cost $1 billion in the first year. Clearly, baulking at this “large cost,” the paper instead modelled adjustments to thresholds based on price inflation over a single year, from June 2017 to June 2018, and applying that inflation factor to current thresholds beginning 1 April 2017. This produced a cost of $220 million for the 2017-18 year rising to $720 million by 2019-20.
The paper concluded by noting “a downside to not annually indexing is that there is less transparency for taxpayers.” This is something that politicians of both hues will rather conveniently rely on when trumpeting “tax cuts.”
Although fiscal drag is a well known tactic, Bill English also employed variations of it elsewhere to raise revenue. In the 2011 Budget inflation adjustments to the student loan repayment threshold of $19,084 were frozen until 1 April 2015. This and other changes to the student loan scheme added up to $447 million in “savings” over five years. The freeze on the student loan threshold was later extended until 1 April 2017.
The 2012 Budget froze the parental income threshold for student allowances until 31 March 2016, a measure worth $12.7 million over four years. More controversially, the same Budget increased the repayment rate applying to income above the student loan repayment threshold from 10% to 12% – a defacto tax increase. This increase raised (sorry “saved”) $184.2 million in operating costs over four years.
The 2011 Budget saw changes which also stopped inflation adjustments of the threshold at which abatement of working for families tax credits applied. Instead, measures reducing the threshold over a four year period from $36,827 to $35,000 were introduced. A “slightly higher” abatement rate of 25 cents in the dollar instead of 20 cents in the dollar was also phased in over the same period. These measures were intended to realise savings of $448 million over four years. (The current government’s Families Package partly reversed these changes by raising the abatement threshold to $42,000 whilst lifting the abatement rate to 25 cents in the dollar from 1 July 2018).
The 2011 Budget also removed the exemption from employer superannuation contribution tax (ESCT) on employer contributions to KiwiSaver funds. This is probably the biggest single measure that increased the tax take outside of the rise in the rate of GST to 15% in October 2010.
The exemption was removed with effect from 1 April 2012 and the compulsory employer contribution was also increased from two to three percent from 1 April 2013. These changes saw the annual ESCT collected rise by almost $400 million from $681 million in the June 2011 year (the last full year before the changes) to $1,078 million in the June 2014 year (the first full year of the changes).
Finally, there is the opportunity to increase various duties such as those on alcohol, petroleum and tobacco. For example, tobacco excise duty has been increased every year since January 2009 as part of the country’s Smokefree policy. As a result, the excise duty per cigarette has gone from 30.955 cents per cigarette in 2009 to 82.658 cents per cigarette as of 1 January 2018. During the year to June 2018 the government collected over $1.8 billion in tobacco excise duty.
All told, the combination of fiscal drag, ESCT increases and changes to student loans and working for families cumulatively represent at least $1 billion of additional revenue collected annually. Throw in the various excise duty increases, specific “base protection” tax measures such as changes to the thin capitalisation rules for foreign-owned banks or the the “Bright-line test” introduced in 2015, and the increased annual “tax” take is close to $1.5 billion.
These under the counter tax increases have happened with little fanfare under the guise of “savings”, or “better targeting of government programmes” (how the Budget 2011 changes were described). Colbert would no doubt approve of this efficient plucking of the goose with very little hissing.
9 Nov, 2018 | Tax News
Terry Baucher wades through a series recent IRD reports and concludes the taxman has room to improve
Whatever the final recommendations of the Tax Working Group are, Inland Revenue will be a key player in implementing and managing the changes to the tax system. But is it up to the task?
In the run-up to Labour Day weekend it released its 2017-18 annual report and two other reports. Collectively, these reports give a good insight into its current and future state which might be summarised as “Can do better.”
The first report released was the result of some follow up research on “strengthening stakeholder engagement.”
Undertaken by Wellington based research firm Litmus, the research targeted groups identified by Inland Revenue as having an important role in its billion-dollar Business Transformation process. The stakeholders surveyed included central and local government agencies, business representative groups, large enterprises, vendors and suppliers and tax agents/intermediaries.
Litmus surveyed 229 organisations and received 118 responses. Just seven of the mere 10 tax agents surveyed responded. Given there are 5,600 tax agents with over 2.7 million clients, tax agents represent a substantially under-represented demographic in the final survey’s results.
Significantly, the feedback from tax agents was less positive than from other stakeholders. According to the report, tax agents were “less supportive about how Inland Revenue is changing and its ability to deliver”, with only a third “confident Inland Revenue will successfully deliver the change.”
It might be tempting for Inland Revenue to argue the small sample size means the Litmus survey was not representative of tax agents. However, its customer satisfaction surveys show that those tax agents surveyed who were “very satisfied” with Inland Revenue declined from 77% in 2015-16 to 66% in 2017-18. This was the largest drop amongst any of the surveyed groups.
An explanation for the dissatisfaction of tax agents can be found in Inland Revenue’s 2017-18 annual report.
The upgrade of Inland Revenue’s secure online service myIR in April 2018 (“Release 2”) did not go smoothly. Users had problems logging on and some services became unavailable. Frustrated taxpayers and tax agents rang Inland Revenue for assistance only to find their call “capped” by Inland Revenue because call volume exceeded its capacity. As page 38 of the annual report explained:
“We capped 286,392 calls during June 2018 to manage the spike in demand. This is a 69% increase from 169,533 capped calls in June 2017. This contributed to an 85% increase in complaints in April-June 2018 compared to the same three months in 2017. We received 3,541 customer complaints during this quarter, 1,623 of which were received in June 2018.”
Inland Revenue eventually resolved the problems encountered in Release 2, but it faces a much bigger test with Release 3 next April which will affect over a million taxpayers.
Its annual report has some fascinating details about how Inland Revenue is progressing with its Business Transformation programme. Its use of contractors and temporary staff has almost tripled in the past three years: increasing from $45.3 million in the June 2015 year to $124.1 million in the June 2018 year. Spending on contractors and temporary staff represented 22.8% of all Inland Revenue’s $545 million personnel costs for the June 2018 year.
The increase in the use of contractors and temporary staff is almost certainly down to implementing the Business Transformation programme. 11% of Inland Revenue’s 5,250 staff are now on fixed-term contracts compared with 2% in June 2014. Despite this shift, the proportion of staff who are female has remained constant at 64% over the same period. However, the department has a gender pay gap of 19.4% as the difference in average salaries for men and women is $16,235. As the report explains “Women only make up 43% of the people who earn over $100,000, while they make up 68% of the people who earn under $100,000.”
After four years of declining recruitment Inland Revenue made 604 new hires in 2017-18. However, during the year 938 staff left which is why Inland Revenue paid out over $21 million in termination benefits, a more than twenty-fold increase from the $919,000 paid during the 2016-17 year. The staff losses meant its staff turnover for 2017-18 was 15.4% overall, not exactly an encouraging sign of a healthy workplace. Curiously though, the average length of service of staff rose to 13.6 years. (Incidentally, the department paid $339,000 in bonuses during the year although it’s not clear to whom).
And yet, despite all these comings and goings, Inland Revenue’s personnel costs for the June 2018 year were lower than budget by over $87 million. According to the report:
“The majority of this variance reflects the change in both the phasing and delivery of the Business Transformation programme, and organisational change required to deliver the programme outcomes.”
All this points to an organisation in a state of flux with an unsettled workforce, hence the recent strikes. It’s one reason why I and many other tax agents are dissatisfied with Inland Revenue’s current performance and view the approaching Release 3 next year with some concern.
Apart from collecting $73 billion of revenue during the year, Inland Revenue also did its bit for the government’s books by returning a surplus of more than $59 million to the Crown. This seems to be part of a deliberate policy – over the five years to 30 June 2018 the department recorded surpluses totalling more than $192 million.
The financial statements included in the report have some other interesting revelations: child support collections exceeded payments to caring parents by $181 million. Again, this is a long-standing policy: the corresponding amount for June 2017 was $184 million. Child support late payment penalties, which at 36% per annum in the first year are more than those payable for late payment of tax, effectively represent a backdoor tax on liable parents.
A serious review of child support debt is long overdue: despite writing off $594 million of debt during the year, the total child support debt at 30 June was $2,259 million. This is Inland Revenue’s largest single debtor type. By comparison the total of GST, PAYE and income tax outstanding at 30 June was $2,841 million. The $1,662 million of child support penalties owed is more than the $1,651 income tax outstanding, an absurd position.
Inland Revenue also collected $49.796 million of “other revenue” during the year. Unexplained in Inland Revenue’s annual report, it transpires that this is the total of penalties imposed in relation to late repayment of overpayments of working for families’ credits. I found the answer in note 3 to the government’s financial statements for June 2018, which includes $231 million of “Child support and working for families penalties” in its Sovereign Revenue for the year.
To put that total in context, it’s almost double the $118 million of court fines included as revenue in the government’s financial statements. Penalties on top of repaying overpaid working for families credits seems a harsh outcome for what is most likely to be the result of an error.
The annual report also details the vast amount of data sharing going on between Inland Revenue and other government agencies. During the year the department received 520,561 “contact records” from the Department of Internal Affairs. The Ministry of Social Development (MSD) provided details to Inland Revenue during the year relating to 94,378 child support cases. MSD also shared 7,041,500 student loan cases in what must have been a one-off information transfer. Inland Revenue in return shared details with MSD relating to 1,373,489 Community Service Card holders, 402,047 child support cases as well as proactive information sharing for 743,346 benefits and student cases.
Quite apart from data sharing with other government agencies, during the year Inland Revenue sent details of 128,930 persons to the Australian Tax Office as part of its Student Loan collection programme. This resulted in matches being found for 85,147 persons who will soon find they have not escaped their student loan repayment obligations.
The extent of data sharing currently going on between Inland Revenue and other agencies here and around the world is enormous yet goes largely unnoticed. It invariably comes as an unpleasant surprise to anyone caught up by the data exchanges. A data leak would surely represent one of the biggest risks for the department, but it’s not clear from the annual report whether the independent Risk and Assurance Committee has specifically considered the issue.
The other document released, Statement of Intent 2018-2022 (the SOI) is rather like a glossy corporate brochure packed full of buzz-words and corporate-speak. The SOI never uses the word “taxpayer/taxpayers”, instead “customer/customers” appears 141 times in the 24-page document. This aversion to using the word “taxpayer” is also apparent in Inland Revenue’s Annual Report: it appears a mere 41 times in 224-pages compared with 708 mentions of “customer/customers” – more than 17 times more frequently.
The use of “customer” is well meant, but in my view is ultimately disingenuous. It implies a voluntary relationship which simply does not apply to an organisation extracting money with the full power and backing of the state. As anyone involved in a dispute with Inland Revenue will attest, its view is not “the customer is always right,” but “the taxpayer is guilty until proven innocent.” The alternatives to Inland Revenue are not a “competitor” tax agency, but either outright non-compliance or emigration. Inland Revenue would do better to more honestly recognise that for most people it is the “Bad Guy” and use its new “customer-centric” approach to ameliorate that reality.
In fairness, for all its earnest corporate-speak, the SOI recognises that Inland Revenue’s future success is dependent on trust. Page 11 of the SOI comments:
“[Trust] is vital for motivating people to pay their taxes and for the successful implementation of policy. This trust has been eroding in many countries. The situation is not yet clear in New Zealand, but longer term it may mean Inland Revenue cannot rely on operating in an environment of high trust. There are already differing levels of trust in Inland Revenue and the wider public sector between different ethnic, socio-economic, and demographic groups.”
Currently Inland Revenue will need to work hard to maintain trust in it, particularly amongst tax agents. The next stage of the Business Transformation programme (Release 3) in April 2019 is therefore both a threat to that trust yet also an excellent opportunity to reinforce the public’s trust in it. Inland Revenue is at present outwardly confident that Release 3 will succeed. We’ll have the first verdicts on whether that confidence was justified in under six months’ time. Watch this space.
24 Sep, 2018 | Tax News
Although intertwined with the issue of capital gains, finding a fairer treatment for retirement savings is arguably the most important objective for the TWG, says Terry Baucher
Rather like Dug in Up almost all the commentary around the Tax Working Group’s (TWG) interim reporthas chased the squirrel of capital gains tax (CGT).
Although probably inevitable, the focus on CGT risks overlooking some of the other issues analysed in what is probably the most comprehensive overview of New Zealand’s tax system in nearly thirty years. These other issues would include land tax, GST and retirement savings.
Although a final decision on the optimum approach to taxing capital gains will wait until the TWG’s final report next February, the Government has accepted that the TWG need not carry out further analysis of areas such as wealth tax, land tax, changes to New Zealand’s petroleum and minerals royalty regimes, GST coverage and a financial transactions tax.
I am very surprised that a land tax is completely off the table, particularly after the Victoria University of Wellington Tax Working Group came out strongly in favour of it in 2010. Reading between the lines, the TWG appears to have decided the politics of a land tax are even more difficult than those around a CGT. Conversely, given the general tenor of the TWG’s comments on the issue of taxing capital, removing the land tax option probably increases the likelihood of either a CGT or taxing capital based on a risk-free rate of return being recommended.
No change for GST
On the other hand it is no surprise that the TWG isn’t recommending changes to the current GST framework. The arguments for exempting food from GST are pretty comprehensively demolished by the following graph illustrating the average weekly benefit for each income decile resulting from removing GST from food:
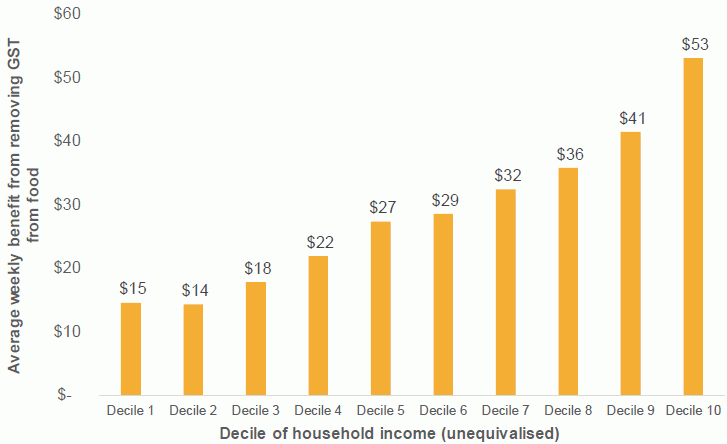
In order to achieve this benefit, the TWG estimates an exception for food and drink would reduce the GST take by $2.6 billion. As the group notes, if that amount was instead redistributed, each household would receive $28.85 per week, or practically double the benefit of a GST exemption for the lowest two deciles. As the TWG concluded other measures than an exemption, such as welfare transfers, would be likely to produce greater benefits for the same cost.
This point is also borne out when considering an alternative measure, an across the board cut in GST from 15% to 13.5% costing $2 billion annually. The result was indentical to that for introducing a GST exception; there were significantly greater benefits to households in the highest income decile.
The TWG then compared a GST rate reduction with two alternative measures: a tax-free threshold of $7,000 and halving the lowest tax rate from 10.5% to 5.25%.
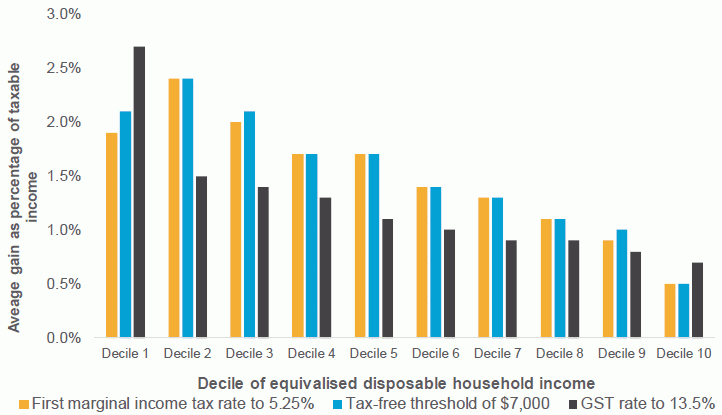
The conclusion was that based on percentage of income, reducing the GST rate to 13.5% would provide greater benefits to households in the lowest income decile when compared with the suggested income tax changes. However, there were fewer benefits for households in deciles 2-9 and households in the highest income decile would be the biggest winners.
The TWG therefore decided against recommending a reduction in GST rates, suggesting instead:
“If the Government wishes to improve incomes for very low-income households, the best means of doing so will be through welfare transfers.
If the Government wishes to improve incomes for certain groups of low to middle income earners, such as full-time workers on the minimum wage, then changes to make personal income taxes more progressive may be a better option.”
As part of its review the TWG looked at whether financial services such as bank fees should be brought within GST and eventually determined “there are no obviously feasible options for doing so.” Instead, the TWG proposes the Government should monitor international developments.
The TWG also dealt briskly with the idea of a financial transactions tax (or Tobin tax) on tax on the purchase, sale, or transfer of financial instruments. This was proposed by ‘many submitters’ on the basis of improving market stability and discouraging speculative trading. The TWG concluded:
“The revenue potential of a financial transactions tax in New Zealand is likely to be limited, due to the ease with which the tax could be avoided by relocating activity to Australian financial markets…A financial transactions tax is an inefficient tax that is unlikely to raise significant revenue for New Zealand.”
The door isn’t completely shut on a financial transactions tax, with the TWG recommending the ongoing international debate on the issue be monitored.
Changes ahead for KiwiSavers?
In many ways it’s appropriate Sir Michael Cullen is chair of the TWG as his imprint lies directly and indirectly across the current treatment of retirement saving. Sir Michael was part of the Fourth Labour Government’s radical overhaul of savings in the late 1980s which adopted the present Taxed – Taxed – Exempt’ (TTE) basis for retirement savings. In 2007 as Finance Minister in the Fifth Labour Government he introduced KiwiSaver and the Portfolio Investment Entity (PIE) tax regime. Both, were, more than a little ironically, measures aimed at redressing some of the issues which emerged in the wake of the adoption of the TTE regime.
The report’s review of KiwiSaver begins with an interesting analysis of the impact of inflation on taxation. The report observes:
“Although inflation is currently low, nominal interest rates are also low; this has made inflation a larger component of the nominal interest rate and therefore increased the real effective tax rate on debt.”
The effect of inflation is illustrated in the following table:
| Table 7.2: The future value of $1,000 invested today after 30 years |
|
No tax |
Tax real income |
Tax nominal income |
| 17.5% |
28% |
17.5% |
28% |
| Future value of $1000 in 30 years |
$4,322 |
$3,719 |
$3,396 |
$3,362 |
$2,889 |
| Effective tax rate on nominal income |
N/A |
10.5% |
16.8% |
17.5% |
28% |
Effective tax rate on real income
(after taking account of inflation) |
N/A |
17.5% |
28% |
29.2% |
46.7% |
The report concludes that the member tax credit offsets the impact of taxing nominal income for KiwiSaver members earning up to approximately $100,000 per annum. Above that level of income the member tax credit’s effectiveness diminishes.
As the TWG report notes the TTE basis of taxation was, and remains, a significant divergence from the ‘Exempt – Exempt – Taxed’ (EET) basis common in many OECD countries. However, reverting to EET would be a very expensive move: the report estimates the annual fiscal cost of doing so would be at least $2.5 billion initially.
Even with strict limits on contributions most of the tax benefits of moving to an EET system would flow through to high-income earners. The TWG, rightly in my view, considers there is “little value in providing incentives to high income-earners, who are likely to be saving adequately in any case.” (Part of the reason for high income-earners being better savers is that they are more likely to be property owners).
This background of inflation and the potentially expensive and regressive risks of saving concessions led the TWG to:
“Focus on options that are targeted towards low- and middle-income earners – which, in turn, will disproportionately benefit women (who are more likely than men to be on lower incomes, due to part-time work or time out of the paid workforce for caring responsibilities).”
The TWG’s two main proposals are therefore:
- Remove the Employer Superannuation Contribution Tax (ESCT) on the employer’s matching contribution of 3% of salary to KiwiSaver for members earning up to $48,000 per year; and
- Reduce the lower PIE rates for KiwiSaver funds by five percentage points each.
The ESCT proposal would reverse the change introduced in the 2011 Budget and revert the treatment of employer contributions back to what it was when KiwiSaver was established at an estimated annual cost of $180 million. The reduction in PIE rates for KiwiSaver funds would cost a modest $35 million annually.
The TWG also considered the implications for KiwiSaver funds of taxing gains on New Zealand and Australian shares, a matter raised by National MP Paul Goldsmith in Parliament last week. The measure would impose tax of approximately $15 million per annum for those KiwiSaver members with income below $48,000, far outweighed by the proposed changes.
However, the change would cost approximately $45 million per annum for higher income KiwiSaver members. As a counter to this, the TWG suggests the member tax credit could be increased from its present 50 cents per dollar to 60 cents per dollar at an annual cost of $190 million.
Although intertwined with the issue of capital gains, finding a fairer treatment of retirement savings is arguably the most important objective for the TWG. This is because there are now almost 2.9 million KiwiSaver members, 1.3 million (46%) of whom are under the age of 35.
The sums involved with KiwiSaver are large and growing: in the twelve months to August 2018 employer and employee contributions exceeded $5.4 billion with Member Tax Credits contributing a further $785 million. Employees and employers contributed a record $612 million in August 2018 alone.
The TWG proposals for retirement savings therefore will have a significant impact for a large and growing number of New Zealanders long into the future. The interim TWG proposals are modest but do represent a positive step forward. More than just property owners will be watching and awaiting the TWG’s final recommendations.
13 Aug, 2018 | Tax News
Terry Baucher crunches the numbers around corporate tax and says anybody expecting the Tax Working Group to suggest a cut in the tax is going to be disappointed
Anyone who thinks the Tax Working Group will suggest a cut in company income tax in its interim report due to be released next month is going to be disappointed. Recently released papers prepared for the TWG concluded a cut was “unlikely to be in New Zealand’s best interests.”
The papers also contain some fascinating data about the size and profitability, or otherwise, of various industry sectors.
To cut or not to cut
At 28% New Zealand’s company tax rate was the 10th highest in the OECD in 2017. It is also above the unweighted OECD average of 24.9% for the same year. However, this doesn’t take into account the imputation regime which means the final tax rate for New Zealand tax resident investors is the shareholder’s marginal tax rate. As a result of the imputation regime the effective tax rate for New Zealand resident shareholders is the sixth lowest in the OECD.
Unless a company tax rate cut was accompanied by a reduction in personal income tax rates, the main benefit for New Zealand resident investors would be the opportunity to accumulate income taxed at a lower rate before distribution at which point it would be taxed at personal income tax rates. According to Inland Revenue the existing five percentage points gap between the company tax rate and top individual tax rate has encouraged “a variety of arrangements that…allow taxpayers to avoid the intended taxation of dividends on the distribution of income or assets from companies to their shareholders”. (As the same paper later notes some of these “integrity issues would be reduced if a capital gains tax were introduced.”)
These integrity issues plus additional complexity are also cited as reasons against a lower tax rate for small businesses. In addition, officials consider a small business tax rate is likely to reduce overall productivity, a long-standing problem for New Zealand. There is also the possibility that a small business tax rate might act as a disincentive to growth for businesses, a criticism the Fraser Insitute in Canada raised of a recent Canadian government proposal.
Nevertheless, New Zealand’s comparative position within the OECD is likely to worsen following the dramatic cut in the United States corporate tax rate from 35% to 21% with effect from this year. A cut in company tax rates is sometimes suggested so that New Zealand can remain “competitive”, so at first sight it seems likely pressure for a corporate tax cut may increase as company tax rates fall internationally.
Conversely, one of the key arguments against a company tax cut was the issue of “location-specific economic rents.” Economic rents are the returns over and above those required for investment in New Zealand to take place. As the paper notes these returns are “likely to be larger in a geographically isolated market like New Zealand where supply of certain goods and services is likely to require a physical presence in New Zealand.” In short, such returns can be taxed without discouraging investment as New Zealand’s location means investment remains viable despite taxation. In other words, if overseas investors are making a return with a 28% company tax rate, there is no need to incentivise them to invest with a lower tax rate. In fact as officials noted doing so would not be in New Zealand’s interests as more of the benefit would flow to non-residents.
Another revealing insight was that there appears to be little correlation between a cut in company tax and an increase in foreign direct investment (FDI). Despite a cut in the company tax rate from 33% to 30% in 2008 and then to 28% with effect from 1 April 2011, there was no surge of FDI into New Zealand either absolutely, or relative to Australia as the following graph illustrates:
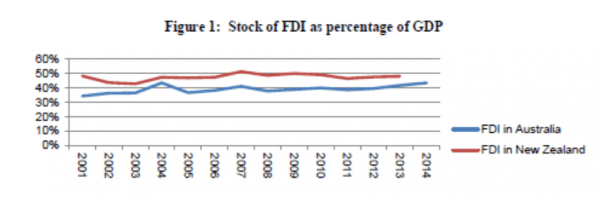
There may have been other factors at play but as officials noted “it should at least cause us to question any assumptions that company tax cuts are likely to be a silver bullet for increasing the level of FDI into New Zealand.”
A narrow base?
Separate from the issue of company tax rates, another background paper analysed the effective tax rates for companies. Although results were advised as “indicative only” the paper threw up some interesting and at the same time potentially alarming statistics.
The analysis focused on “significant enterprises” (groups of entities with annual consolidated turnover greater than $80 million) over the 2013 to 2016 tax years. Apparently, there are only about 500 such enterprises in New Zealand and between them they are responsible for about 51% of the total income tax paid by companies ($12.6 billion for the year ended 30 June 2017). Furthermore some 20% of these enterprises have either a tax or accounting loss and therefore did not have effective tax rates calculated for the purposes of the paper.
Overall the unweighted average tax rate for those profitable enterprises was 28%, or exactly in line with the company tax rate. However, once adjusted for the relative size of the enterprises, the weighted average rate fell to 20%. That in itself masked substantial variations between industries. 21 industries had effective unweighted company tax rates of less than 25%. In particular, the unweighted average effective company tax rate for the insurance and superannuation fund, residential care services, and motion picture and sound recording activities industries was 16%. Remarkably, 38% of the enterprises within these three industries were making a tax loss even though only 11% reported an accounting loss.
To help explain the variation in effective tax rates, the paper then reviewed the major tax adjustments in the 2015/16 tax year. Based on a sample of large enterprises which had approximately $13 billion in net taxable income for the year, the three most significant adjustments which decreased taxable income relative to accounting profit were untaxed realised capital gains amounting to $2.2 billion, unrealised valuation gains ($1.3 billion) and untaxed overseas dividends of $1 billion.
Conversely, those adjustments which increased taxable income included non-deductible accounting write-downs ($1.1 billion), non-deductible capital losses from sales of fixed assets ($600 million) and other non-deductible expenditure such as goodwill write-offs ($280 million).
The paper also looked at the untaxed capital gains for small and medium companies over the same four tax years. It found the average yearly value of untaxed capital gains was $2.2 billion with companies within the rental, hiring and real estate services averaging gains of $763 million each year. The research also noted that the following four industries had particularly high proportions of untaxed realised gains when compared with the accounting profits of the industry:
- Accommodation and food services (64%)
- Agriculture (53%)
- Rental, hiring and real estate services (40%)
- Financial and insurance services (27%)
In something of a throwaway comment the paper remarked that “the majority of small and medium enterprise are in a loss position”. Given the number of small businesses in New Zealand it’s not reassuring to hear that many are in loss.
What does all this mean? Quite apart from reducing the likelihood of a company tax rate cut, the analysis shows the relative importance of untaxed capital gains to several industries. After noting “the primary cause of under-taxation is untaxed capital gains, both realised and unrealised” officials then asked the TWG “Does this information affect the Group’s views on business and company tax”. We’ll know the answer next month when the TWG’s interim report is relased but defenders of the status quo on the taxation of capital gains are likely to have their work cut out.
17 May, 2018 | Tax News
Terry Baucher crunches all the tax news in the Budget, and says going into the 2020 election is when we might see changes in tax thresholds
With any major tax initiatives all kicked over to the Tax Working Group for review, unsurprisingly the Budget made no changes to existing tax rates and thresholds.
No increases in thresholds results in extra tax revenue through the effect of ‘fiscal drag’ whereby individuals pay more tax as their earnings ‘drag’ them into higher tax brackets.
For the year to 30 June 2018 the fiscal drag effect is calculated as $276 million. By 30 June 2022, when the total tax take is predicted to rise by almost 25% to over $103 billion, it will be $398 million.
At some stage thresholds, which have not been increased since 2010, will need to be adjusted, but for the moment the government, like its predecessor, is happy to collect the additional revenue.
Two significant tax changes were announced prior to the Budget. The major initiative is the ring-fencing of residential property losses. From 2020 it will no longer be possible to offset losses against other income. Instead the losses must be carried forward for future use. The additional tax collected as a result of this change is $125 million for the June 2021 year rising to $190 million for the June 2022 year.
The other change – and one likely to affect more taxpayers – is the introduction of GST on low-value imported goods from 1 October 2019. The current estimate is for this measure to raise $218 million between 1 October 2019 and 30 June 2022.
In the meantime, Inland Revenue will get a further $31.3 million of funding over the next four years to boost compliance. $23.5 million of this is specifically targeted at ensuring outstanding company tax returns are filed.
Another $3 million is to analyse the potential for improved tax compliance in ‘specific industries’ through better third-party reporting and withholding taxes. This is probably aimed at contractors not currently covered by the PAYE rules.
Overall, Inland Revenue expects to recover approximately an additional $239 million over the four years to 30 June 2022 from enhanced compliance activities.
There’s some more details about the Research and Development tax incentive which will involve $1 billion over four years. Eligible businesses spending more than $100,000 annually on R&D will get a rebate of 12.5 cents for every dollar of R&D spend.
In a nod to the Deputy Prime Minister’s love of racing the bloodstock tax rules will change to allow deductions to be claimed for the “costs of high-quality horses acquired with the intention to breed.” A snip at $4.8 million over the next four years.
Migrants can expect to pay another $113 million in fees over the next four years, and the Immigration Levy is expected to raise another $44.7 million over the same period.